
Flourish
Create interactive charts and maps with no-code templates for teams across newsrooms, marketing, and finance.
Recommended for
- Pre-Seed
- Seed
- Series A
- Scaleup
- Late-Stage
SSIE
Stage Fit Recommendations
Following data shows why Flourish is recommended for listed teams. The Fit Score represents the percentage fit of Flourish to each company stages, as calculated by the SSIE.
Stage
Fit Score
Fit Reasons
Pre-Seed
$0–$10k MRR
86- Create interactive charts maps and stories
- Share and manage visualizations with team folders
- Visualizations only accessible via TLS and SSL
- Free plan covers about 2 users at no cost
Seed
$10k–$100k MRR
89- Create and edit visualizations through the API
- Update charts automatically from live CSV data
- Free plan covers about 3 users at no cost
Series A
$100k–$500k MRR
87- Annual penetration tests include external testing
- Enterprise plan can enforce two-factor authentication
- Set publishing approval workflows for organizations
- Free plan to start
Scaleup
$500k–$2M+ MRR
88- ISO 27001 certified by British Standards Institute
- Connect visualization interactions to analytics systems
- Enterprise plan, priced through sales
Late-Stage
$2M+ MRR
89- SAML single sign-on for enterprise users
- Role-based permissions support team governance
- Enterprise plan, priced through sales
Description
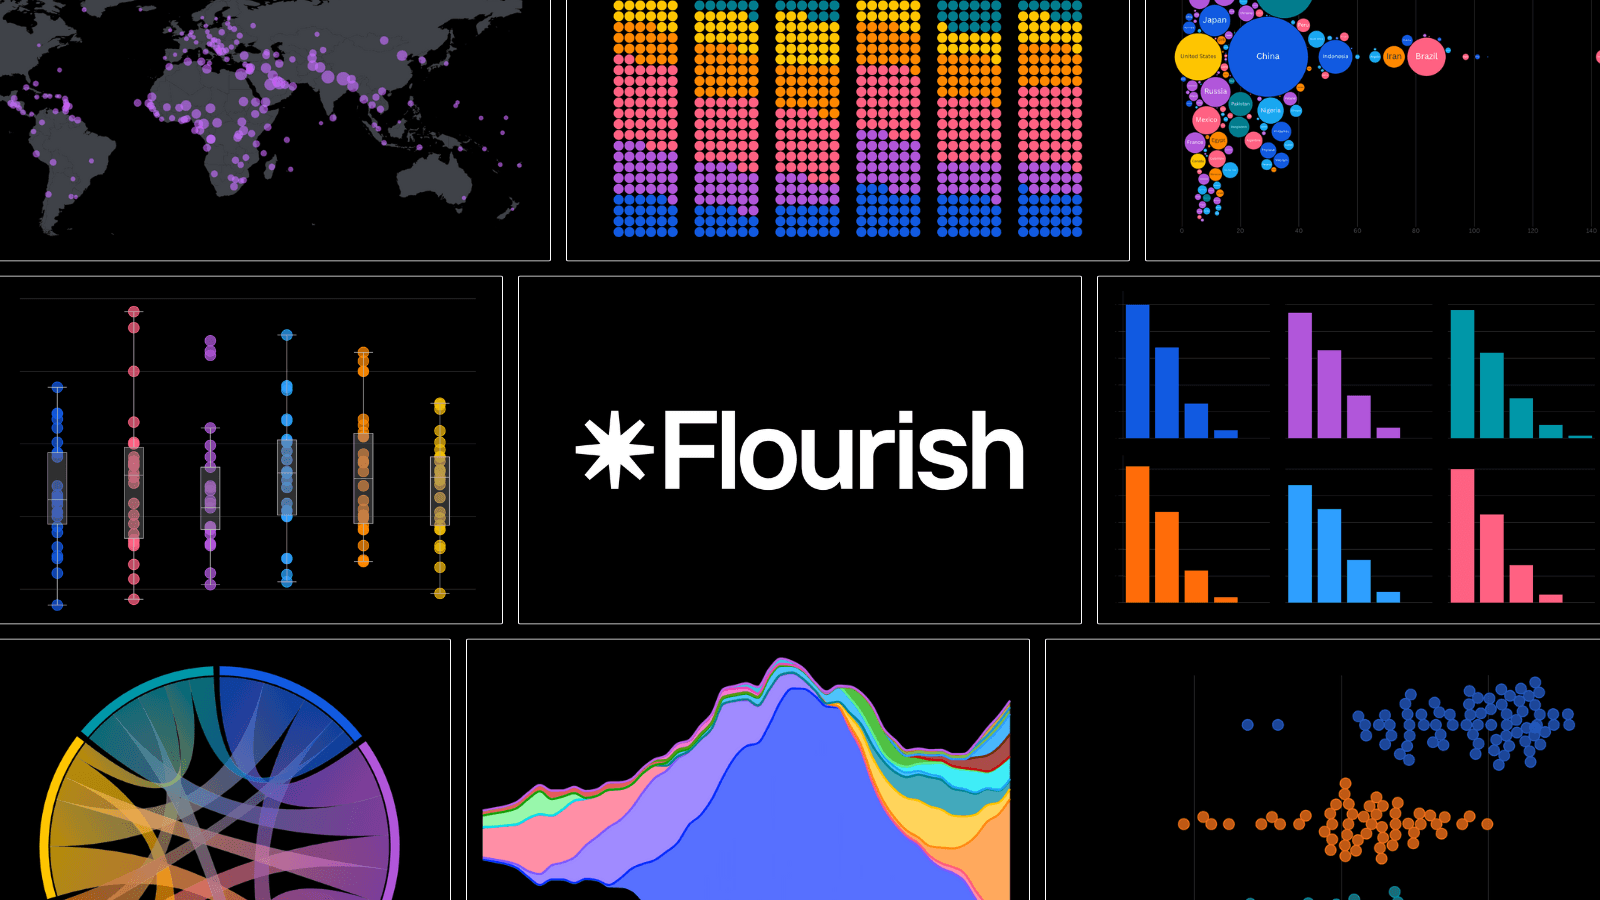
Flourish is an interactive data visualization tool for creating charts, graphs, and maps. It offers no-code templates for building visualizations without programming skills. Users can create multi-step explainers with charts and captions using Flourish Stories. The platform includes interactive content templates for visualizing text, images, and audio. Flourish Assistant provides AI guidance to help refine charts faster. Flourish Connector allows integration with MCP-compatible AI tools. Visualizations can be embedded in websites, reports, and presentations. Flourish serves industries including financial services, newsrooms, marketing, government, and education.

FAQs
Flourish is a no-code tool for creating interactive charts, maps and data stories. Teams use it to communicate findings in reports, presentations, digital publications and websites.
Yes. Live CSV lets you connect to a web-accessible CSV file so visualizations update automatically at regular intervals. Enterprise users can also add API connections.
Pricing
Paste your product url
Live within 24 hours.
Free. No credit card.
Reviewed by a human. SSIE Fit Scoring.
Explore similar products

Cube
Cube delivers AI-native analytics with a semantic layer for embedded business intelligence

Quadratic
An AI-powered spreadsheet for connecting data, writing code, and sharing repeatable insights with teams.

Metabase
Metabase turns raw data into actionable insights with AI-powered no-code analytics
Zoho Analytics
Unlock business intelligence with Zoho Analytics data analytics platform

Tosea
Tosea turns documents into AI-generated presentations with no-code precision

Deepnote
Deepnote streamlines engineering and development with AI-driven no-code tools

Sourcetable
AI spreadsheet for analysts, operators, and finance teams to automate workflows, build models, and create dashboards

Seqora
Desktop SQL client for browsing data, writing queries, and reviewing schema changes before they run.
Explore similar products
Cube
Cube delivers AI-native analytics with a semantic layer for embedded business intelligence
Quadratic
An AI-powered spreadsheet for connecting data, writing code, and sharing repeatable insights with teams.
Metabase
Metabase turns raw data into actionable insights with AI-powered no-code analytics
Zoho Analytics
Unlock business intelligence with Zoho Analytics data analytics platform
Tosea
Tosea turns documents into AI-generated presentations with no-code precision
Deepnote
Deepnote streamlines engineering and development with AI-driven no-code tools
Sourcetable
AI spreadsheet for analysts, operators, and finance teams to automate workflows, build models, and create dashboards